


As mentioned earlier, the most often neglected question with parallel applications is how fast they are in absolute terms. It is possible that this is a throwback to sequential computers, where profiling tools, although available, are rarely used. In most cases, if a program doesn't run fast enough when all the compiler's optimization capabilities are exhausted, one merely moves to a higher performance machine. Of course, this method doesn't scale well and doesn't apply at all in the supercomputer arena. Even more importantly, as processor technology becomes more and more complex, the performance gap between the peak speed of a system and that attained by compiled code gets ever wider.
The typical solution for sequential computers is the use of profiling tools like prof or gprof that provide a tabular listing of the routines in a program and the amount of time spent in each. This avoids the use of the wristwatch but only goes so far. You can certainly see which routines are the most expensive but no further.
The profiler xtool was designed to serve this purpose for parallel computers and in addition to proceed to lower levels of resolution: source code and even machine instructions. Sample displays are shown in Figure 5.15. At the top is a graphical representation of the time spent executing each of the most expensive routines. The center shows a single routine at the level of its source code and the bottom panel shows individual machine instructions.
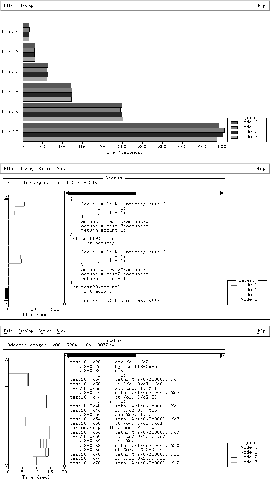
Figure 5.15: Output from the CPU Usage Profiler
The basic goal of this presentation is to allow the user to see where CPU time is being spent at any required level of detail. At the top level, one can use this information to develop or restructure algorithms, while at the lowest level one can see how the processor instructions operate and use this data to rework pieces of code in optimized assembly language.
Note that while the other profiling tools are directed specifically towards understanding the parallel processing issues of an application, this tool is aimed mostly at a thorough understanding of sequential behavior.