


The system first described, vtool, had as its goal the visualization of sequential programs prior to their parallelization. The distribution profiler dtool serves a similar purpose for parallel programs which rely on data distribution for their parallelism. The basic idea is that one can ``watch'' the distribution of a particular data object change as an algorithm progresses. Sample output is shown in Figure 5.14.
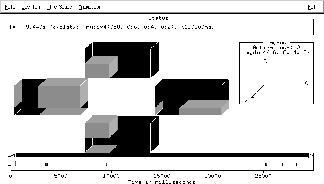
Figure 5.14: Data Distribution Analysis
At the bottom of the display is a timeline which looks similar to that used in the event profiler, etool. In this case, however, the events shown are the redistribution operations on a particular data object. Clicking on any event with the mouse causes a picture of the data distribution among the nodes to be shown in the upper half of the display. Other options allow for fast and slow replays of a particular sequence of data transformations.
The basic idea of this tool is to look at the data distributions that are used with a view to either optimizing their use or looking for places in which redundant transformations are being made that incur high communication costs. Possible restructuring of the code may eliminate these transformations, thus improving performance. This is particularly useful in conjunction with automatic parallelization tools, which have a tendency to insert redundant communication in an effort to ensure program correctness.