


This project of Apostolakis and Kochanek used the Caltech/JPL Mark III
to simulate gravitational lenses . These
are galaxies which bend the light of a background quasar to produce
multiple images of it. Astronomers are very interested in these
objects, and have discovered more than 10 of them to date. Several
exhibit symptoms of lensing by more than one galaxy. This spurred us
to simulate models of this class of lens. Our model systems were
composed of two galaxy-like lensing potentials in different positions
and redshifts. We studied about 100 cases at a resolution of  ,
taking about three weeks of running time on a 32-node Mark III. The
algorithm we used is based on ray tracing. The
problem is very irregular; this led us to use a scattered block
decomposition. We achieved the performance needed for our purposes,
but did not gain large speedups. The feature of the machine that was
essential for our calculation was its large memory, because of the need
for high resolution. Two of the cases we studied are illustrated in
Figures 7.11 and 7.12: Areas on the source
plane that produce one, three, five, or seven images, and the
respective image regions on the image plane can be seen. An
interesting example of an extended source is also shown in each case.
A detailed exposition of our results and a description of our algorithm
for a concurrent machine are contained in [Kochanek:88a] and
[Apostolakis:88d].
,
taking about three weeks of running time on a 32-node Mark III. The
algorithm we used is based on ray tracing. The
problem is very irregular; this led us to use a scattered block
decomposition. We achieved the performance needed for our purposes,
but did not gain large speedups. The feature of the machine that was
essential for our calculation was its large memory, because of the need
for high resolution. Two of the cases we studied are illustrated in
Figures 7.11 and 7.12: Areas on the source
plane that produce one, three, five, or seven images, and the
respective image regions on the image plane can be seen. An
interesting example of an extended source is also shown in each case.
A detailed exposition of our results and a description of our algorithm
for a concurrent machine are contained in [Kochanek:88a] and
[Apostolakis:88d].
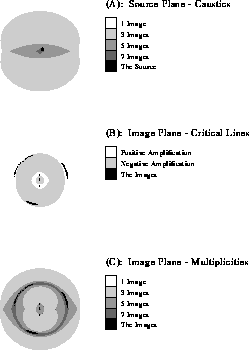
Figure 7.11: Part A shows the areas of the source plane that produce
different numbers of images. Part B is a map of the areas of the image
plane with negative amplification, i.e., flipped images, and positive
amplification. Part C is a similar plot of the image plane, separating
the areas by the total number of images of the same source. An example
extended source is shown in A, whose images can be seen in Part B and
Part C.
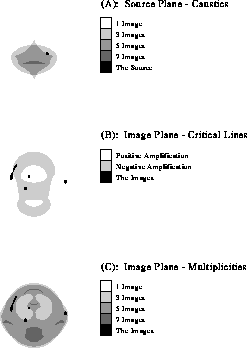
Figure 7.12: Part A shows the areas of the source plane that produce
different numbers of images. Part B is a map of the areas of the image
plane with negative amplification, that is, flipped images, and positive
amplification. Part C is a similar plot of the image plane, separating
the areas by the total number of images of the same source. An example
of an extended source is shown in A, whose images can be seen in Parts B
and C.