


Our approach is to explore the computer vision techniques for map separates. This requires more labor and investment than the neural network method which has the advantage of the ``black box''-type approach, but one expects that the vision based strategy will be eventually more successful. The disadvantage of the backpropagation approach is that it doesn't leave much space for major improvements-it delivers reasonable quality results for low-level separation but it can hardly be improved by including more insights from higher level reasoning modules since some information is already lost inside the backpropagation ``black-box.'' On the contrary, machine vision is a hierarchical, coupled system with feedback which allows for systematic improvements and provides the proper foundation for the full map understanding program.
The map separates problem translates in the vision jargon into
segmentation and region labelling. These algorithms are somewhere on
the border of the early and medium vision modules. We have analyzed
the RGB clustering algorithm for the map image segmentation. In this
method, one first constructs a three-dimensional histogram of the image
intensity in the unit RGB cube. For a hypothetical ``easy'' image
composed of a small, fixed number of colors, only a fixed number of
histogram cells will be populated. By associating distinct labels with
the individual nonempty cells, one can then filter the image, treating
the histogram as a pixel label look-up table-that is,
assigning for each image pixel the corresponding cell label. For
``real world'' map images involving color fluctuation and diffusion
across region boundaries, the notion of the isolated histogram cells
should be replaced by that of the color clusters. The color image
segmentation algorithm first isolates and labels individual clusters.
The whole RGB cube is then separated into a set of nonoverlapping
polyhedral regions, specified by the cluster centers. More explicitly,
for each histogram cell, a label is assigned given by the label of the
nearest cluster, detected by the clustering algorithm. The
pixel
label look-up table-that is,
assigning for each image pixel the corresponding cell label. For
``real world'' map images involving color fluctuation and diffusion
across region boundaries, the notion of the isolated histogram cells
should be replaced by that of the color clusters. The color image
segmentation algorithm first isolates and labels individual clusters.
The whole RGB cube is then separated into a set of nonoverlapping
polyhedral regions, specified by the cluster centers. More explicitly,
for each histogram cell, a label is assigned given by the label of the
nearest cluster, detected by the clustering algorithm. The
pixel region look-up table constructed this way is then
used to assign region labels for individual pixels in the image.
region look-up table constructed this way is then
used to assign region labels for individual pixels in the image.
As a first test of the RGB clustering, we constructed a set of color
histograms with fixed bin sizes and various resolutions
(Figure 17.12). Even with such a crude tool, one can
observe that the clustering method is very efficient for most image
regions and when appropriately extended to allow for irregular bin
volumes, it will provide a viable segmentation and labelling
algorithm. The interactive tool in Figure 17.12 also
provided a nice test of rapid prototyping capabilities of MOVIE. The
whole MovieScript code for the demo is on the order of only  and it was created interactively based on the integrated scriptable
tools for Motif, field algebra, and imaging.
and it was created interactively based on the integrated scriptable
tools for Motif, field algebra, and imaging.
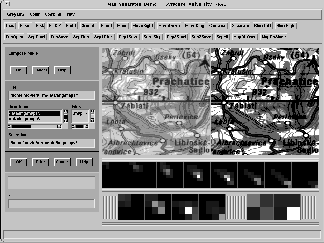
Figure 17.12: Map Separates Tool Constructed in MovieScript in the Rapid
Prototyping Mode to Test the RGB Clustering Techniques. The left image
represents the full color source, the right image is separated into a fixed
number of base colors. Three RGB histograms are constructed with the bin
sizes  ,
,  , and
, and  ,
correspondingly. Each histogram is represented as a sequence of RG planes,
parametrized by the B values. The first row under the image panel contains
eight blue planes of the
,
correspondingly. Each histogram is represented as a sequence of RG planes,
parametrized by the B values. The first row under the image panel contains
eight blue planes of the  histogram, the second row
contains
histogram, the second row
contains  and
and  histograms. The
content of each bin is encoded as an appropriate shade of gray. A mouse
click into the selected square causes the corresponding separate to be
displayed in the right image window, using the average color in the selected
bin. In the separate mode, useful for previewing the histogram
content, subsequent separates overwrite the content of the right window.
In the compose mode, used to generate this snapshot, subsequent
separates are superimposed. Tools are also provided for displaying all
separates for a given histogram in the form of an array of images.
histograms. The
content of each bin is encoded as an appropriate shade of gray. A mouse
click into the selected square causes the corresponding separate to be
displayed in the right image window, using the average color in the selected
bin. In the separate mode, useful for previewing the histogram
content, subsequent separates overwrite the content of the right window.
In the compose mode, used to generate this snapshot, subsequent
separates are superimposed. Tools are also provided for displaying all
separates for a given histogram in the form of an array of images.
The simple, regular algorithm in Figure 17.12 cannot cope with problems such as shaded relief, non-convex clusters, and color ambiguities, discussed above. To handle such problems, we need interactive tools to display, manipulate, and process three-dimensional histograms. The results presented below were obtained by coupling MOVIE field algebra with the AVS visualization modules. In preparation is the uniform MovieScript-based tool with similar functionality, exploiting the currently developed support for the three-dimensional graphics in MOVIE.
The RGB histogram for the ad250 image is presented in
Figure 17.13. Each nonempty histogram cell is represented as a
sphere, centered at the bin center, with the radius proportional to the
integrated bin content and with the color given by the average RGB value of
this cell. Poor color separation manifests as cluster concentration along
the  axis. Two large clusters along this diagonal correspond to
white and grey patches on the image. A ``pipe'' connecting these two clusters
is the effect of shaded relief, composed of a continuous band of shades of
gray. Three prominent off-diagonal clusters, forming a strip parallel to the
major white-gray structure, represent two tints of true green and dark
green, again with the shaded relief ``pipe.'' Brown isoclines are
represented by an elongated cloud of small spheres, scattered along the
white-gray structure.
axis. Two large clusters along this diagonal correspond to
white and grey patches on the image. A ``pipe'' connecting these two clusters
is the effect of shaded relief, composed of a continuous band of shades of
gray. Three prominent off-diagonal clusters, forming a strip parallel to the
major white-gray structure, represent two tints of true green and dark
green, again with the shaded relief ``pipe.'' Brown isoclines are
represented by an elongated cloud of small spheres, scattered along the
white-gray structure.
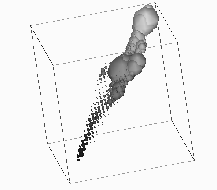
Figure: Color histogram of the ad250 image (see
Figure 17.10) in the unit RGB cube. Histogram resolution
is  . Each bin is represented by a sphere with the
radius proportional to the bin content and with the average color value in
this bin.
. Each bin is represented by a sphere with the
radius proportional to the bin content and with the average color value in
this bin.
The separation of these three elongated structures-white, green, and
brown-represents the major complexity since all three shapes are
parallel and close to each other. The histogram in
Figure 17.13 is constructed with the  resolution, which is slightly too low for numerical analysis (discussed
below) but useful for graphical representation as a black-and-white
picture. The
resolution, which is slightly too low for numerical analysis (discussed
below) but useful for graphical representation as a black-and-white
picture. The  histogram, used in actual
calculations, contains too many small spheres to create any compelling
three-dimensional sensation without the color cues and interactive
three-dimensional tools (however, it looks impressive and spectacular
on a full-color workstation with 3D graphics accelerator). By working
interactively with the
histogram, used in actual
calculations, contains too many small spheres to create any compelling
three-dimensional sensation without the color cues and interactive
three-dimensional tools (however, it looks impressive and spectacular
on a full-color workstation with 3D graphics accelerator). By working
interactively with the  histogram, one can
observe that all three major clusters are in fact reasonably well
separated.
histogram, one can
observe that all three major clusters are in fact reasonably well
separated.
All remaining colors separate in an easy way: Shades of black again form a scattered diagonal strip which is far away from the three major clusters and separates easily from a similar, smaller parallel strip of shades of purple; red separates as a small but prominent cluster (close to the central gray blob in Figure 17.13); finally, blue is very dispersed and manifests as a broad cloud or dilute gas of very small spheres, invisible in Figure 17.13 but again separating easily into an independent polyhedral sector of the RGB cube.
The conclusion from this visual analysis, only partially reproduced by the picture in Figure 17.13, is that RGB clustering is the viable method for separating ad250 into the seven indicated base colors. As mentioned above, this separation process requires human guidance because of the color mapping ambiguities. The nontrivial technical problem from the domain of human-machine interface we are now facing is how to operate interactively on complex geometrical structures in the RGB cube. A map analyst should select individual clusters and assign a unique label/color with each of them. As discussed above, these clusters are separable but their shapes are complex, of them given as clouds of small spheres, some others elongated, non-convex, and so on.
Virtual reality-type interface with the glove input and the three-dimensional video output could offer a natural solution for this problem. For example, an analyst could encircle a selected cluster by a set of hand movements. Also, the analyst's presence inside the RGB cube, implemented in terms of the immersive video output, would allow for fast and efficient identification of various geometric structures.
Right now, we adopted a more cumbersome but also more realistic approach, implementable in terms of conventional GUI tools. Rather than separate clusters, we reconstruct them from a set of small spheres. An interactive tool was constructed in which an analyst can select a small region or even a single pixel in the image and assign an effective color/label to it. This procedure is iterated some number of times. For example, we click into some white areas and say: white. Then we click into few levels of a shaded relief and we say again: white. Finally, we click into the gray region and we also say: white. In a similar way, we click into some number of isoclines with various tints of brown and we say: brown. Each point selected in this way becomes a center of a new cluster.
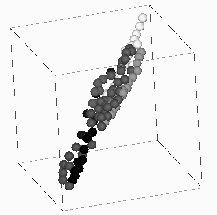
Figure 17.14: A set of  Color Values, Selected Interactively and Mapped
on the Specified Set of Seven Base Colors as Described in the Text
Color Values, Selected Interactively and Mapped
on the Specified Set of Seven Base Colors as Described in the Text
The set of clusters selected this way defines the partition of the RGB cube into a set of nonoverlapping polyhedral regions. Each such region is convex and therefore the number of small clusters to be selected in this procedure must be much larger than the number of ``real'' clusters (which is seven in our case), since the real clusters often have complex, nonconvex shapes.
A sample selection of this type is presented in Figure 17.14. It contains about 80 small spheres, each in one of the seven base colors. Separation of ``easy'' colors such as blue or red can be accomplished in terms of a few clusters. Complex structures such as white, green, and brown require about 20 clusters each to achieve satisfactory results. The image is then segmented using the color look-up table constructed in this way and the weight is assigned to each small cluster, proportional to the integrated content of the corresponding polyhedral region. The same selection as in Figure 17.14, but now with the sphere radii proportional to this integrated content, is presented in Figure 17.15.
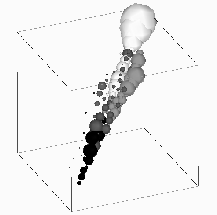
Figure: The Same Set of Selected Color Values as in
Figure 17.14 But Now with the Radius Proportional to the
Integrated Content of Each Polyhedral Cell with the Center Specified by the
Selected RGB Value.
As seen, we have effectively reconstructed a shape with topology roughly similar to the original histogram in Figure 17.13 but now separated into the seven base colors.
The resulting separated image is presented in Figure 17.16 and compared with the JPL result in Figure 17.11 in the next section.
Figure: Image ad250 from Figure 17.10, Separated
into Seven Base Colors Using the RGB Clustering Algorithm with the Clusters
and Colors Selected as in Figure 17.15.