To analyze a program using XPVM, a user need only compile their program using the PVM library, version 3.3 or later, which has been instrumented to capture tracing information at run-time. Then, any task spawned from XPVM will return trace event information, for analysis in real time, or for post-mortem playback from saved trace files.
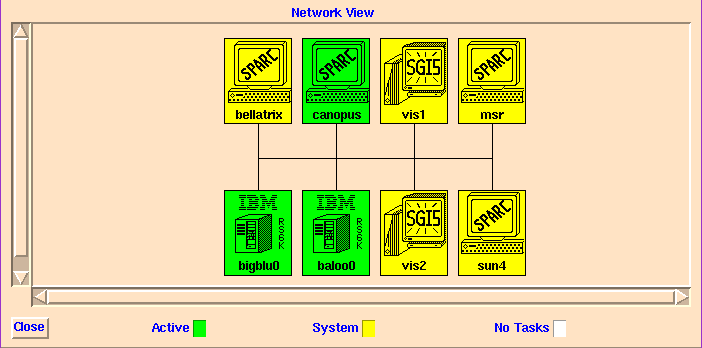
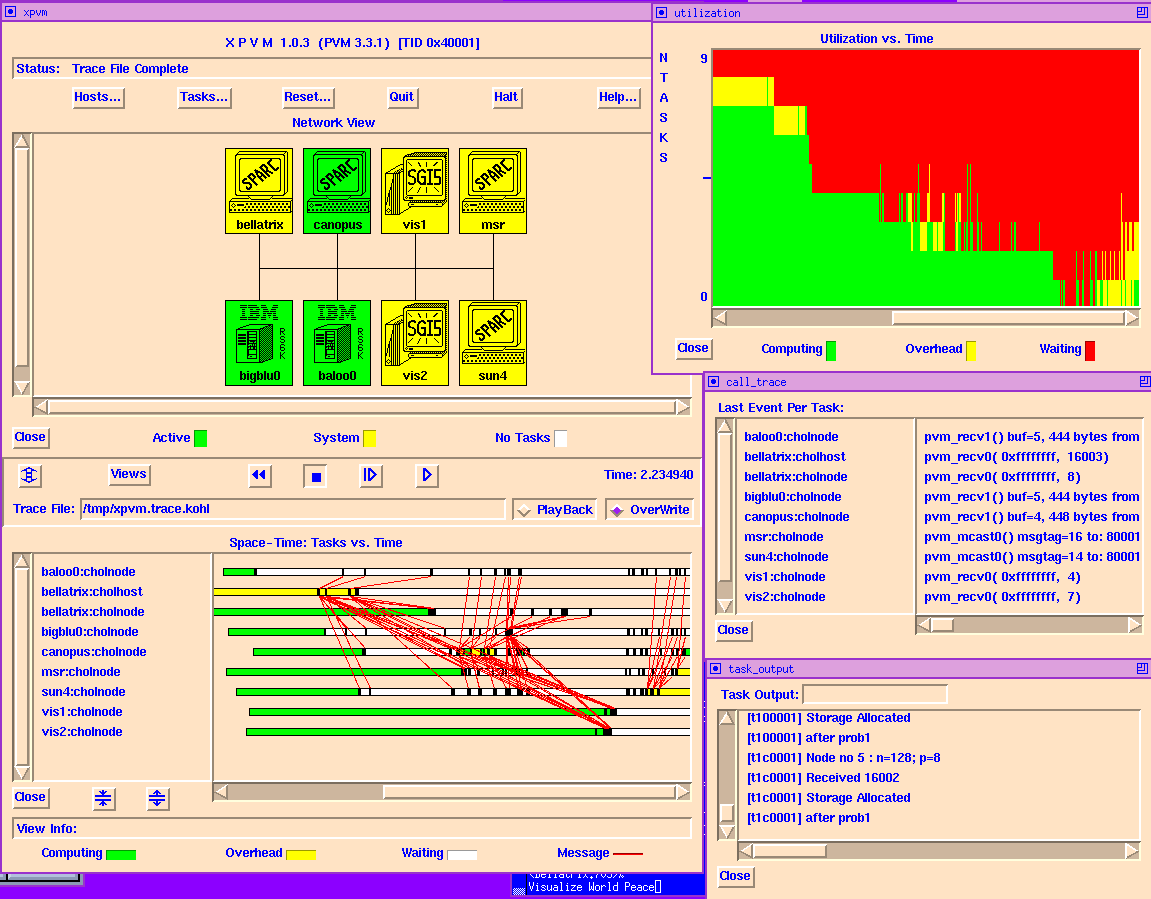
The Network View displays high-level activity on the hosts in the Virtual Machine. Each host is represented by an icon image which includes the architecture and name of the host. These icons are illuminated in different colors to indicate the status of the tasks running on each host.
The "Active" color implies that at least one task on that host is busy executing useful work. The "System" color means that no tasks are busy executing user computation, but that at least one task is busy executing PVM system routines. When there are no tasks on a given hosts, its icon is left uncolored, or white. The specific colors used in each case default to green for active and yellow for system, but are user customizable.
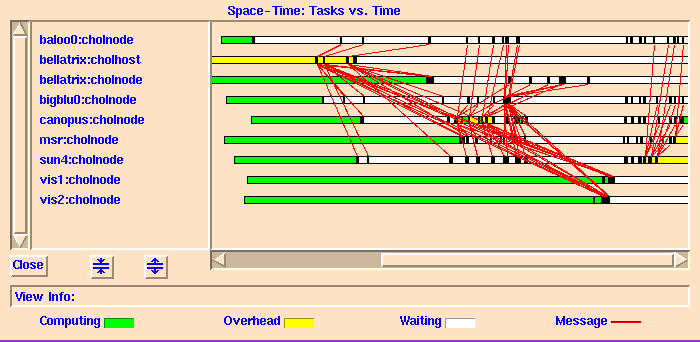
The Space-Time View shows the status of individual tasks as they execute across all hosts. Each task is represented by a horizontal bar along a common time axis, where the color of the bar at each time indicates the state of the task.
The "Computing" color shows those times when the task is busy executing useful user computations. The "Overhead" color marks the places where the task executes PVM system routines for communication, task control, etc. The "Waiting" color indicates those time periods spent waiting for messages from other tasks, i.e. the idle time due to synchronization. Communication activity among tasks is also shown, using lines drawn between the task bars at the corresponding message send and receive times. The default colors for these states are green for computing, yellow for overhead, white for waiting, and red for messages. A vertical, blue line marks the latest trace event time, as shown in the trace control panel "Time" display.
More detailed information regarding specific task states or messages can be extracted from the Space-Time view by clicking and holding on the view area with the Left mouse button. When a task bar is clicked on, the information line at the bottom of the view changes to display the precise times that the task state began and ended, plus info on the PVM system routine that was called at the start of the state (or in some cases perhaps more appropriately the end of the last state). Individual messages can be clicked on as well to determine the time when the send was initiated, and the time when the message receipt was completed, plus the number of bytes sent and the message code. The Space-Time View can also be "zoomed" in or out to view different perspectives on the same trace data.
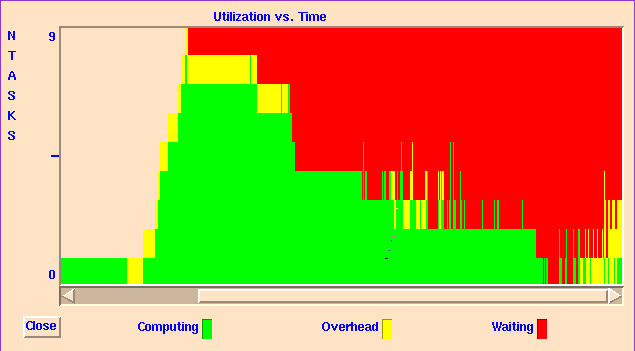
The Utilization View summarizes the Space-Time View at each time instant, showing the number of tasks Computing, in Overhead, or Waiting for a message at any given time. This information is represented by three colored rectangles, stacked vertically at each time instant, with Computing on the bottom, Overhead in the middle, and Waiting on top. The default colors are green for Computing, yellow for Overhead, and red for Waiting.
The overall utilization for tasks is seen by comparing the relative height of the rectangles over time, such that in cases of good utilization the Computing areas are prominent, and for poor utilization the Overhead and Waiting areas dominate. This view instantaneously scales to the maximum number of tasks encountered, to provide an accurate representation of the utilization.
The Utilization and Space-Time Views are tightly coupled, and share the same horizontal time scale. Entering either view area with the mouse pointer creates a blue time line in both views. This lines identifies the same time instant in each view's display, to help correlate the two representations. The Utilization View is also automagically zoomed in or out to match the Space-Time View's time scale.


The trace event information is shown in the Call Trace View, which lists the details of the last trace event received for each PVM task currently executing. This information is updated on-the-fly to always provide the latest information. All task output is shown in a scrolling text view.
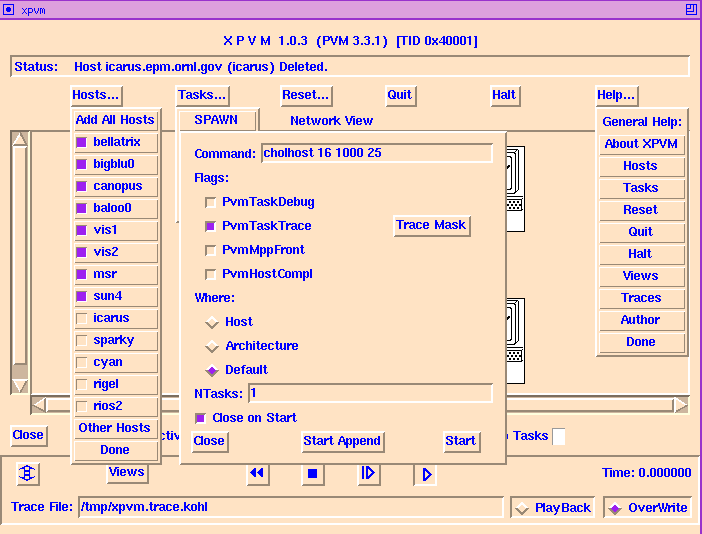
XPVM will automatically start up PVM on your machine if it is not already running, and users can specify a default list of hosts to include in this start-up configuration, using a ".xpvm_hosts" file in their home directory (see on-line help under "Hosts" in XPVM). There are also several new command line arguments supported in XPVM that allow customized selection of default host files, trace files, and the local machine name (to allow various network interface choices). To see XPVM's command line options, execute "xpvm -HELP" (the "-help" option is predefined for TCL applications :-).
Good Luck!